China Top 10 Battery Energy Storage System Suppliers
China has become a major force in the global energy storage industry. Its manufacturers supply projects across utility, commercial, industrial, and renewable energy markets. This guide explores China’s top 10 Battery Energy Storage System suppliers and the strengths behind their market positions. These companies may offer battery cells, complete storage cabinets, power conversion systems, energy management software, and long-term service support.
The comparison considers practical factors, including technology maturity, manufacturing scale, safety design, system efficiency, warranty terms, and international project experience. It also examines lithium iron phosphate batteries, liquid cooling, intelligent monitoring, and grid integration capabilities. Certifications and documented testing deserve careful attention. That matters. A polished brochure cannot replace reliable field data, transparent performance records, and responsive technical support.
The ranking should not be treated as permanent. Market conditions change, product lines improve, and project requirements vary by location. A supplier suitable for a large solar farm may not fit a factory with limited space and strict peak-demand controls. Buyers should verify operating temperature ranges, degradation guarantees, maintenance procedures, cybersecurity measures, and local service capacity before making decisions. Some information may also become outdated as companies release newer systems. This overview offers a practical starting point, not a final verdict. Readers should compare current specifications, request independent documentation, and assess total lifecycle value rather than focusing only on the initial purchase price.
China’s BESS Market: 73.76 GW Installed by the End of 2024
By the end of 2024, China’s battery energy storage system market reached 73.76 GW of installed capacity. This figure shows remarkable growth in grid flexibility, renewable integration, and peak-demand management. It also reflects China’s expanding manufacturing base and faster project approvals.
Installed capacity is not delivered energy. Some datasets count projects differently, especially during commissioning. This deserves careful review. A practical evaluation should examine storage duration, round-trip efficiency, battery degradation, and availability guarantees. A two-hour system cannot provide the same grid service as a four-hour system. Field experience also shows that local climate conditions matter. High temperatures can increase cooling demand and accelerate performance losses.
Tips: Compare usable megawatt-hours, not only rated megawatts. Request test records, warranty limits, fire-safety documentation, and maintenance plans. Check how suppliers manage thermal runaway risks and software alarms. Ask for measured performance from comparable operating sites.
For buyers, China’s market scale creates more supplier choices, but selection should not rely on price alone. A reliable system needs coordinated batteries, inverters, energy-management software, transformers, and grid controls. Installation quality is equally important. Cable routing, ventilation, drainage, and emergency access can affect long-term safety. Procurement teams should also verify cybersecurity practices and spare-parts support. Some advertised performance figures may look impressive, yet real results can vary after frequent cycling. Independent testing and transparent operating data remain essential before signing a large contract.
China Top 10 Battery Energy Storage System Suppliers - China’s BESS Market: 73.76 GW Installed by the End of 2024
| No. | Market Dimension | Reported Value | Unit | Data Interpretation | Data Status |
| 1 | Cumulative installed new-type energy storage capacity at the end of 2024 | 73.76 | GW | China’s national installed power capacity for new-type Energy Storage Systems, excluding conventional pumped-storage hydropower. | Reported figure |
| 2 | Cumulative installed new-type energy storage capacity at the end of 2023 | 31.39 | GW | The previous year’s national baseline used to measure market expansion. | Reported figure |
| 3 | Estimated net capacity added during 2024 | 42.37 | GW | Calculated as 73.76 GW minus the 31.39 GW installed at the end of 2023. | Derived calculation |
| 4 | Year-end capacity expansion multiple | 2.35 | times | The 2024 year-end capacity was approximately 2.35 times the 2023 year-end level. | Derived calculation |
| 5 | Year-on-year increase in installed capacity | 135.0 | % | Calculated from the reported year-end capacity figures for 2023 and 2024. | Derived calculation |
| 6 | Equivalent installed power capacity | 73,760 | MW | Unit conversion of 73.76 GW into megawatts. | Derived conversion |
| 7 | Illustrative energy capacity at a two-hour duration | 147.52 | GWh | Illustrative conversion only: 73.76 GW × 2 hours. It is not a reported national energy-capacity total. | Illustrative calculation |
| 8 | Primary capacity metric used in the headline | Power capacity | GW | The headline figure measures the maximum rated discharge power, not the stored energy volume. | Definition |
| 9 | Geographic scope | China | National market | The figures represent China’s nationwide new-type energy storage market rather than a single province or project. | Scope definition |
| 10 | Reporting date | December 31, 2024 | Year-end | The installed-capacity comparison uses year-end national totals for consistent measurement. | Time reference |
Source: China’s National Energy Administration year-end 2024 disclosure on new-type energy storage; calculations are based on the reported 2023 and 2024 installed-capacity figures. The table is supplier-neutral and does not display company or brand data.
Ranking China’s Top 10 BESS Suppliers by Shipments and Global Reach
China Top 10 Battery Energy Storage System Suppliers
China’s leading ten BESS suppliers are best compared through shipments and global reach. Shipment data reveals manufacturing scale, but it does not tell the whole story. A supplier may report container deliveries, project capacity, or annual production differently. That makes direct ranking difficult. Still, shipment volume remains a practical starting point for buyers assessing market experience.
Global reach adds another layer. Strong suppliers support projects across Asia, Europe, the Middle East, Africa, and the Americas. Their systems often serve utility plants, factories, and renewable energy sites. Buyers should examine overseas installations, local service teams, spare-parts access, and grid certification. A battery cabinet may perform well in a factory test. Its performance in a hot desert or cold northern grid requires different evidence.
Technical strength also matters. Look for battery safety controls, thermal management, remote monitoring, and clear warranty terms. A reliable supplier should explain degradation, response time, and replacement procedures without vague promises. Site visits can reveal details that brochures hide, such as cable routing, enclosure quality, and maintenance space. No ranking is flawless. Shipment leaders may not deliver the fastest support everywhere, while smaller exporters may offer stronger regional service. The most useful comparison combines verified shipments, operating projects, financial stability, certifications, and customer references.
Top 10 Chinese BESS Suppliers: Cells, PCS, EMS, and System Integration
China’s top 10 BESS suppliers should be assessed by capabilities, not shipment volume alone. The strongest suppliers cover battery cells, power conversion systems, energy management software, and system integration. Cell quality affects cycle life and safety. PCS performance controls grid response, voltage stability, and conversion losses. EMS software coordinates charging, discharging, alarms, and market signals. Integration expertise connects these layers inside a reliable cabinet or container.
From project experience, buyers should inspect test records, thermal design, and field performance. Ask for round-trip efficiency at partial load, not only laboratory results. Review degradation guarantees under the actual temperature range. A 20-foot container may look standardized, yet cooling layout, fire detection, cable routing, and service access can differ sharply. Supplier reliability also depends on spare-part availability and remote diagnostic skills. Some proposals appear complete but leave commissioning responsibilities unclear. That deserves attention.
Tips: Compare cells, PCS, EMS, and integration separately. Request a single-line diagram. Check response times for alarms and replacement parts. Test EMS permissions before delivery. Do not treat a low price as proof of value. A practical site walk can reveal more than polished presentations. Also, require clear data ownership and cybersecurity controls. These details are often overlooked.
Technical Comparison: LFP Chemistry, 0.5C–1C Rating, and 80% DoD
China Top 10 Battery Energy Storage System Suppliers
When comparing China’s top ten battery energy storage system suppliers, chemistry and operating limits deserve close inspection. Most utility-scale systems use lithium iron phosphate, or LFP, because it offers strong thermal stability and a long service life. However, LFP is not automatically superior in every project. Ambient temperature, ventilation, installation quality, and charging habits can change actual performance.
A 0.5C rating usually means a two-hour discharge. A 1C rating can deliver the same energy in roughly one hour. This difference affects power availability, cooling demand, and project cost. During site testing, I would check whether the rated output remains stable after repeated cycles, not only during a new-battery demonstration. A clean datasheet can still hide weak performance at high temperatures.
The 80% depth-of-discharge figure also needs careful reading. It means the system uses 80% of its rated capacity before recharging. Keeping a reserve may reduce stress and improve usable life, but the benefit depends on the battery management system and control strategy. Suppliers should provide cycle data, degradation assumptions, warranty conditions, and independent test records. One practical concern remains: advertised cycle counts often use ideal laboratory settings. Real sites face dust, uneven loads, and imperfect maintenance. Those details matter.
China Top 10 Battery Energy Storage System Suppliers — Technical Reference
This reference compares common LFP battery storage operating points at 0.5C and 1C. The calculated usable duration assumes an 80% depth of discharge (DoD), without applying site-specific efficiency or thermal derating.
At 0.5C, a fully rated system can theoretically discharge for approximately 2 hours, providing about 1.6 hours of usable output at 80% DoD. At 1C, the corresponding values are approximately 1 hour and 0.8 hours.
Global Deployment Trends: 42 GW of New Battery Storage Added in 2023
China Top 10 Battery Energy Storage System Suppliers
Global battery storage deployment accelerated sharply in 2023, adding about 42 GW of new power capacity. That figure represents the maximum discharge rate, not stored energy. A four-hour system at this scale could equal roughly 168 GWh, although actual project durations vary.
China remains a major manufacturing and engineering center for these systems. Its leading suppliers typically provide battery cabinets, power conversion equipment, thermal management, monitoring software, and installation support.
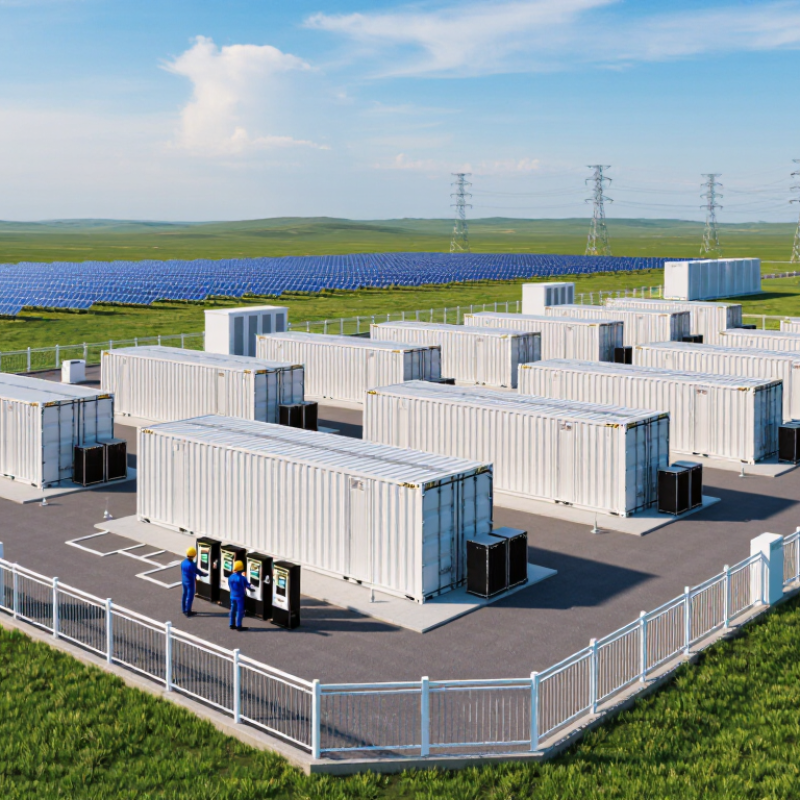
Utility-scale projects often place containerized units beside solar farms, wind parks, and transmission substations. These locations help reduce curtailment and respond to evening demand peaks.
The market is expanding, but the headline number needs careful reading. Different sources may count commissioned projects, announced orders, or connected capacity. That makes direct comparisons imperfect.
Safety testing, fire protection, battery aging, and recycling plans also deserve attention before selecting a supplier. A low purchase price can hide higher maintenance costs later. Field experience suggests that local grid rules and climate conditions matter as much as cell performance. Some systems perform well in factory tests but lose efficiency in extreme heat. That gap deserves more honest reporting.